


March Madness isn’t just for watching hoops. It’s a proving ground for any brand, team, or league in sports—and this year, Ripple Analytics deployed MediaTrack Landscape to capture the moment. This report zooms-in on jersey patch sponsors, revealing how brands, like Nike and Air Jordan, showed up across social.
The numbers are staggering and strategic: over $17M in earned media value and 83K uploads tracked across the tournament from social media. With the majority of impact driven by earned media channels and partners, this is a masterclass in why complete measurement matters. It breaks down where that value came from—and how brands can harness it going forward.
The Jersey Brand Bracket: Nike Wins, But Air Jordan Steals Efficiency Gold
.avif)
Nike drove $8.9M in EMV with 33 teams, while Air Jordan earned $4.2M with just 8 teams.
Why It Matters: Nike captured the most total value—but Air Jordan outpaced everyone on a per-team basis. It’s a striking example of quality over quantity in brand alignment.
Not All Jerseys Are Created Equal: One Brand More Than Doubled the Others
Among all jersey sponsors, Air Jordan teams averaged nearly double the EMV per team compared to others.
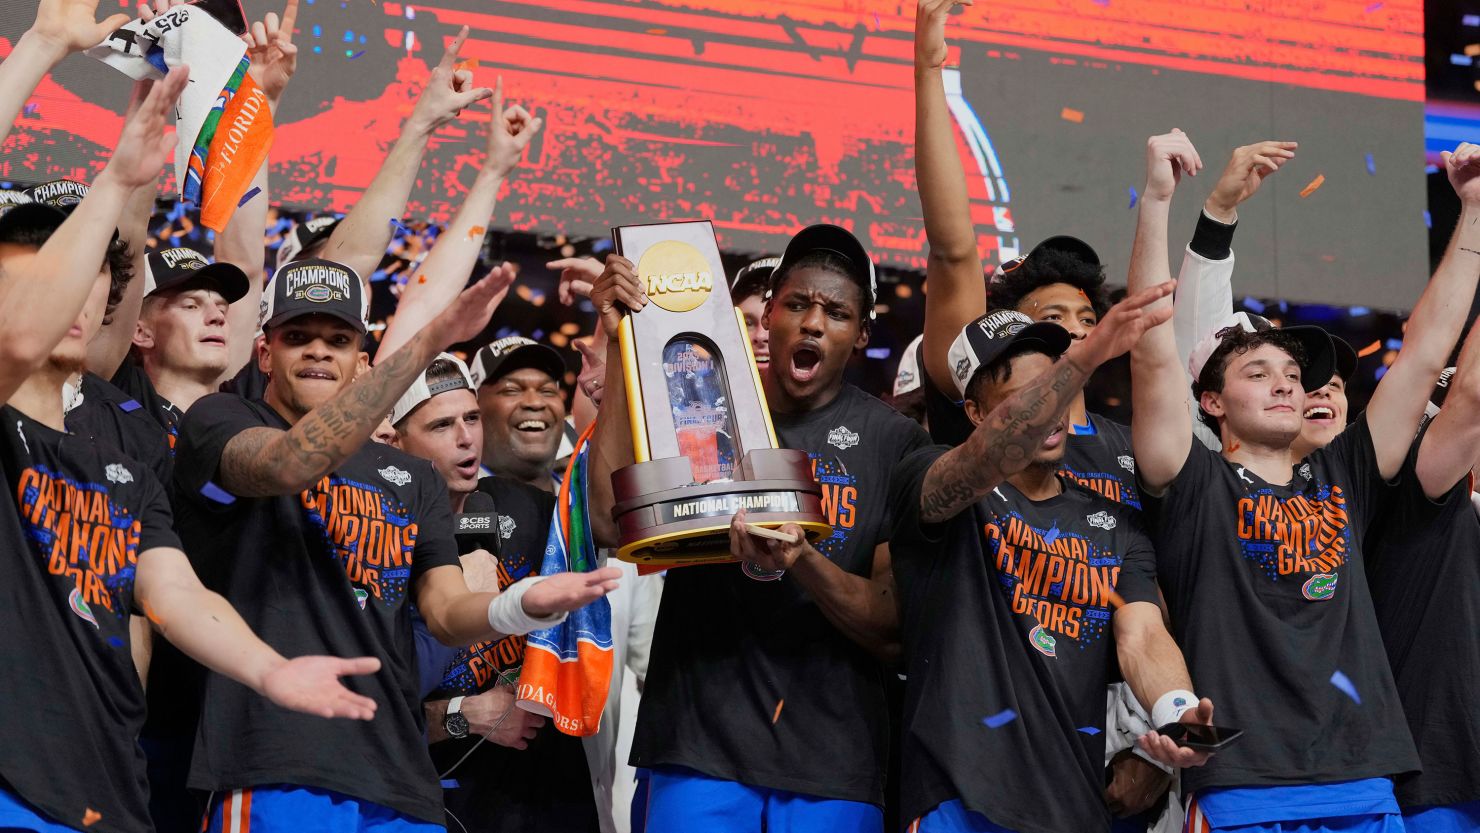
Why It Matters: EMV per team is a critical indicator of how well a brand’s roster is activating during cultural tentpoles. Air Jordan’s concentrated impact suggests deeper resonance with fans, especially with National Champion Florida.
Social Champs: Duke and Florida Delivered the Biggest Brand Wins
Duke ($2.3M) and Florida ($1.6M) led all teams in total EMV, with Auburn, Houston, and Kentucky rounding out the top five.
Why It Matters: Team success on the court isn’t the only factor—social resonance and fan engagement define the true winners in digital. These teams delivered standout value for their respective jersey sponsors.
Miss the Earned Media, Miss the Moment
UGC and media partners accounted for 59% of total uploads and EMV across March Madness.
Why It Matters: The bulk of social value came from channels outside the team or league’s control. If you're not tracking earned media, you're missing the majority of impact—especially during cultural moments like this.
Understanding the Ripple Effect on Social Media
- Efficiency Beats Volume: Air Jordan drove $4.2M in value with just 8 teams—nearly double the average EMV per team compared to Nike. For brands, this reinforces the importance of strategic alignment over sheer scale.
- Per-Team Metrics Tell the Real Story: EMV per team is a more telling performance indicator than total value alone. This lens helps brands and sponsors evaluate the true return from each partnership.
- Top Teams are Brand Engines: Duke and Florida didn’t just win on the court—they led in social-driven EMV, delivering millions for their jersey partners. High-performing teams become digital amplifiers.
- Earned Channels Can’t Be Ignored: UGC and media outlets accounted for 59% of all uploads and EMV. If you’re not measuring these voices, you’re missing the majority of your exposure.
- MediaTrack Landscape Delivers Next-Level Context: Ripple’s rollout of Landscape at scale marked a new era in sponsorship intelligence—capturing, attributing, and benchmarking brand value across every post and platform.
“March Madness is one of the most valuable fan engagement moments of the year. With MediaTrack Landscape, our clients didn’t just measure performance—they understood it in context, relative to every other brand in the ecosystem.”
Eyal Arad
Chief Executive Officer / Ripple Analytics
